
As a business owner, you’re likely juggling a variety of tasks to keep your business running smoothly. One very important aspect that can’t be overlooked is monitoring your website’s performance. Here’s where Google Analytics steps in, acting as a compass in the ever-changing landscape of the digital world.
Note, some businesses may not have changed over their website tracking and analytics account to Google Analytics 4 (GA4). These sites will not be currently recording data at all as the previous Universal Analytics version of Google Analytics has been discontinued. This article uses the term Google Analytics as GA4.
What is GA4?
GA4 provides the potential to view user activity across multiple platforms and devices, including mobile, web, and offline channels. It places emphasis on event tracking and website journeys to produce useful data. It has built-in machine-learning capabilities that help identify trends and opportunities. This helps you to optimise your campaigns and improve your overall customer experience.
Why Metrics Matter
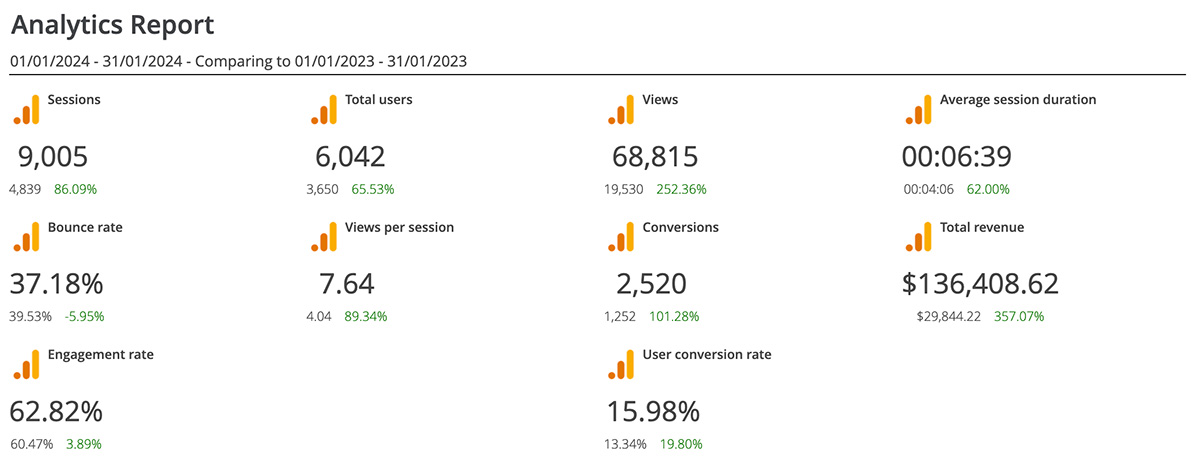
Google Analytics provides actionable data that informs you of how well your website is performing. There are many metrics available, but it can be overwhelming to determine which ones you should be focussing on. This article highlights the key metrics you need to track to assess the health and progress of your online platform and marketing activities, allowing you to make smart, data-driven decisions.
Key Google Analytics Metrics Defined
- Sessions: This metric counts the total number of sessions within a given time frame. A session is a period during which a user is actively engaged with your website.
- Users: ‘Users’ represents the number of unique visitors that have landed on your site.
- Bounce Rate: The percentage of visitors who navigate away from the site after viewing only one page.
- Session Duration: This metric measures the average length of a session. Longer durations typically suggest that visitors find your site valuable and engaging.
- Views: Views count the total number of pages viewed. Repeated views of a single page are also counted.
- Views per Session: It provides information on the average number of pages viewed during a session.
- Session Sources: This indicates where your site’s traffic is coming from – direct visits, search engines, referral sites, or social networks.
Each of these metrics offers insights into different aspects of your website’s performance, from audience engagement to content appeal. By analysing this data, you can begin to understand your audience’s behaviour and make more informed choices about how to improve your site and marketing strategies.
Core Google Analytics Metrics for Businesses
- Users and New Users: The fundamental metrics of web traffic analysis. Keeping track on the number of unique visitors, especially new ones, can give you insights into the reach of your online presence.
- Sessions: A higher number of browsing sessions generally indicates compelling content or product and service offers that bring visitors back.
- Average Engagement Duration: This tells you how long visitors are staying engaged with your content. The longer they stay, the more likely they are finding your content relevant.
- Bounce Rate: A high bounce rate might indicate that people are not finding what they’re looking for on your site, or your landing pages aren’t engaging enough.
- Engagement Rate: The converse of bounce rate, this is the percentage of users that browsed content or took an action on a page. Bounce rate + Engagement rate equals 100%.
- Conversion Rate: We’ll expand on conversions a bit later in this post. However, if you’re selling a product or service, this metric is crucial as it reflects the percentage of visitors who are taking the actions you want to track.
- Entrances and Exits: Understanding where on your site users enter and exit can indicate the effectiveness of your landing pages and your site’s navigation.
- Views Per Session: Are your visitors exploring your site or just hitting one page? This metric helps answer that.
- Returning Users: A returning visitor is a likely indicator of interest in your business. It demonsrates the rate at which your site is of interest in terms of content and product and service offers.
Tailoring Analytics to Your Goals
It is important to understand that not all metrics will be of the same importance for every business. Consider what you most want to achieve through your website – is it increasing sales, boosting engagement, getting subscriptions, or building awareness – and prioritise the metrics that align with these goals.
Understanding Events and Conversions
Events in Google Analytics 4 (GA4) represent the interactions that users have with your website that are tracked on a page load. These include user actions like scrolling depth, link clicks, downloads, form submissions, video plays, and more. Events in GA4 give you a more granular look at how users engage with your content and help to understand the customer journey.
Conversions in GA4 are the essential actions that you want users to take on your website. Conversions are where a click becomes a customer. These actions could include clicking a specific call to action button, shopping cart actions, completing a purchase, signing up for a newsletter, or filling out a contact form. In GA4, these conversions are tracked when a user triggers an event that you have designated as a conversion. This is different from previous versions of Google Analytics, where conversions were tied to specific goals or transactions. By identifying which events are most valuable to your business, you can set them as conversions in GA4 to gain insight into how effectively your site is achieving your key objectives.
Enhancing Business Insights: The Role of Conversions and Ecommerce Tracking
- Conversions: Set up specific conversion goals in GA4 to measure when a user completes an action that is critical to your business, such as making a purchase, signing up for a newsletter, or filling out a contact form. Understanding your conversion rates will help you gauge the success of your website and marketing efforts.
- Ecommerce Purchases: One of the default and most telling metrics for online stores, the ecommerce conversion rate reveals the number of sessions that resulted in a transaction. It’s a direct indicator of your online store’s effectiveness in turning visitors into buyers.
- Revenue Tracking: Integrating ecommerce tracking allows you to see the revenue your site generates. Monitoring this metric is essential to evaluate the financial performance of your digital operations.
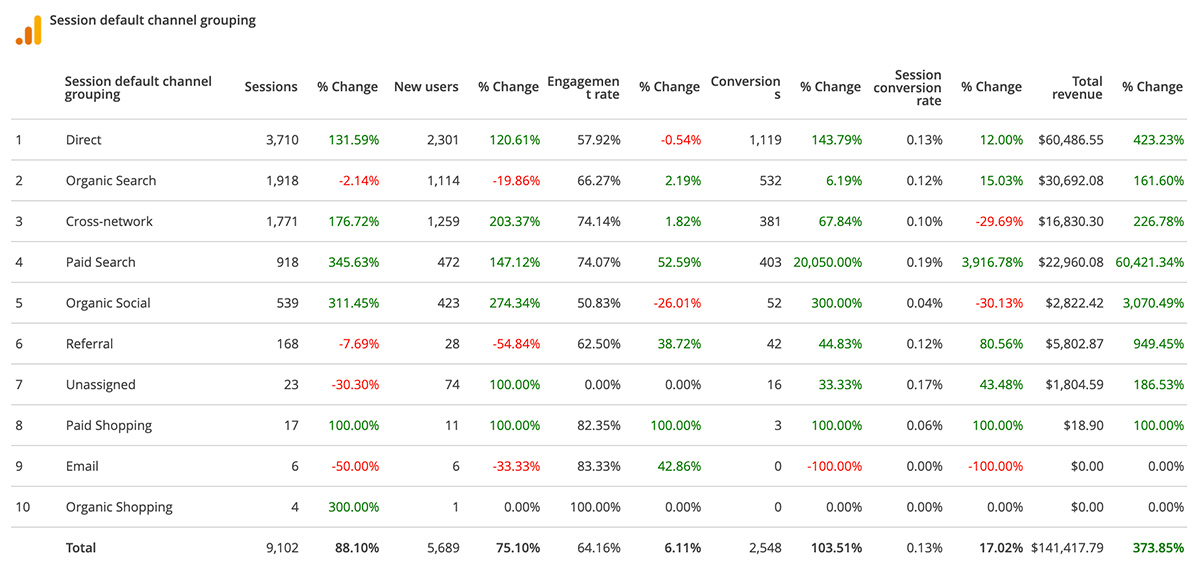
- Purchases (or desired conversion) by source: This is a table that shows from the number of purchases or either selected conversion your site generated per traffic source. This allows you to work out the conversion rate per channel, e.g. how many came from organic search, email campaigns, paid search, or social sources.
- Shopping Behaviour: Add to Cart, Remove from Cart, Begin Checkout, and Purchase are our events that can be tracked. Purchases are conversions by default depending on how your GA4 was setup, however you can choose to add the other events as conversions as it does demonstration shopping activity. This data allows you to calculate your cart abandonment rate.
- Ecommerce Purchases: Knowing which products are your best-sellers and which aren’t meeting expectations allows you to make informed decisions about inventory, promotions, and product development.
Identifying Traffic Sources in GA4
In Google Analytics 4 (GA4), traffic source groupings represent the origins of your website’s traffic, which can include search engines, social networks, referring websites, or direct visits. Understanding these sources is critical for discerning how users find your website. GA4 categorises traffic into different channel groupings:
- Direct: Visitors who arrive at your site by typing your URL directly into their browser or through a bookmark. This can also include links from email clients that are offline and the URL has no tracking parameters. It is a bit of a catch all category for trafffic that doesnt fall into any of the other categories.
- Organic Search: Users who come to your site from a search engine result, without paid advertising.
- Paid Search: Visitors who click on a paid advertisement in search results to land on your site. Other paid search sources are Paid Shopping and Cross-network which will appear if you are using Google Shopping ad campaigns.
- Social: Traffic originating from social media platforms, whether from paid ads or organic posts. Note, if you have set up your paid social campaigns with dedicated URL parameters, data from these will appear in your GA4 as Paid Social.
- Referral: Users arriving on your site from another website that links to yours.
- Email: Visitors who click on links in your email marketing campaigns.
Data is available to expand the above groups so you can identify which search engines, which referring websites, and what king of paid search channels are most effective.
Staying Ahead
The online competitive marketplace is ever-changing and competition is fierce. By concentrating on these key Google Analytics metrics, you’ll be equipped with an understanding of what is currently working, what improvements need to be made, and what opportunities exist to increase your traffic and conversions.
We at HyperWeb can help ensure your GA4 is set up correctly and is tracking the data you need to understand how well your website and marketing strategy is performing, or not. Our marketing clients receive monthly reports with analysis and recommendations.
If you would like a assessment of your GA4 metrics contact us for a free consultation.
Understanding the metrics available from Google Analytics 4 is essential for any business aiming to optimise its digital presence and marketing strategies. GA4’s focus on user-centric events and conversions gives businesses a detailed understanding of their customers’ journey. By leveraging the data on conversions, ecommerce interactions, and traffic sources, organisations can make data-driven decisions to improve their online performance. At HyperWeb, our expertise is not just in setting up and interpreting GA4 metrics, but also in transforming this data into actionable insights, leading to tangible and measureable improvements for your business. Develop a more insightful and successful digital strategy by reaching out to us for a comprehensive GA4 evaluation and consultation.