We keep track and report on all sorts of analytics data on website performance and traffic information for a lot of our content management and marketing clients. It is interesting to see how the trend in mobile usage has increased over time for them all.
It goes without saying that it is so important for many reasons for your website to be responsive and mobile friendly, not only to enhance the mobile browsing experience for your visitors seeking your important information, but also because the dominant search engine, Google, is now using it as a ranking factor in its search engine returns.
While for some sectors, the percentages are influenced by seasonal factors, particularly retailers, and others by dominant marketing channels, the average statistics for the percentage of users accessing your website via a mobile or tablet is worth emphasising.
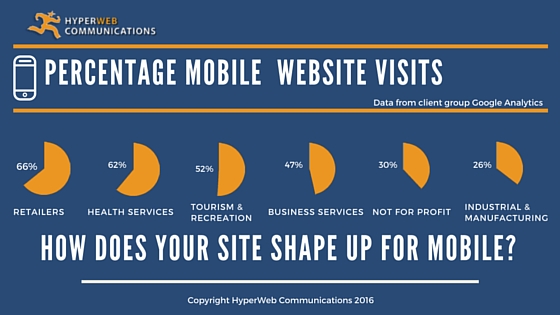
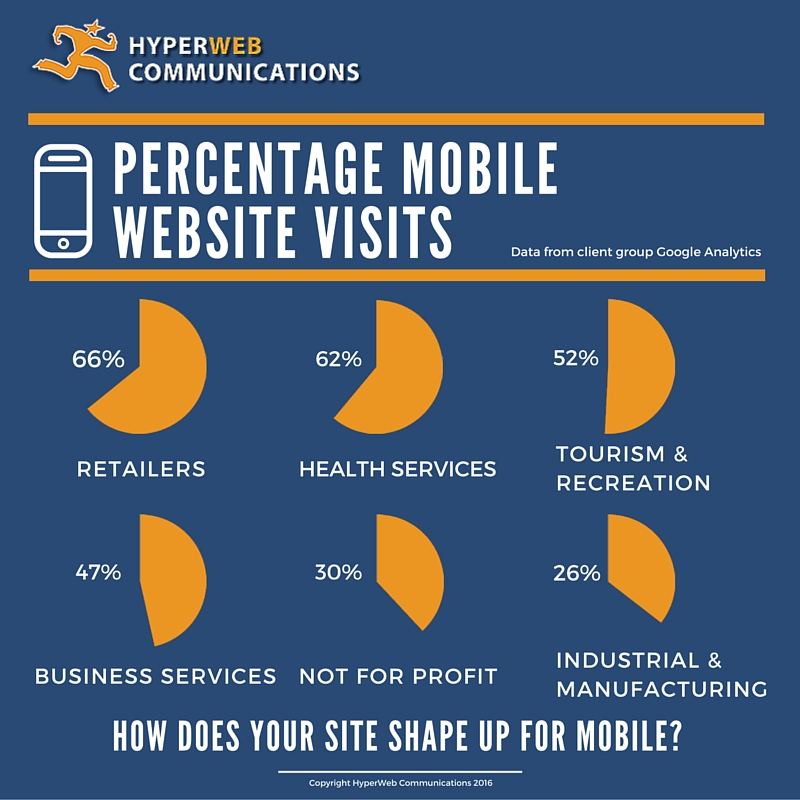
We have been able to break it down into industry sectors using data from many clients that fill each sector. The infographic speaks for itself, but allow me to elaborate.

The highest from our client group is Retail. Generally the average is around 66%, however if you consider seasonal and occasional shopping times such as Christmas and the need for Public Holiday trading hours information, it can reach well into the 80%. These are huge numbers for retail businesses relying on their website to enhance the shopping experience, not just eCommerce stores, but physical retailers as well.
Health Services is also quite high, again because location, operating hours, and expertise details are highly sort after in a mobile environment when users are preferring a more personal experience in seeking information about health issues.
For the above two groups, where the market is high repeat and local, we would suggest thinking about a native smart phone app as we have developed for a local shopping centre in recent times. This way you can provide a more direct experience to your regulars looking for a common set of frequently sought after content or functionality.
Tourism & Recreation is also understandably higher than 50% when you consider people researching holiday and short stay destination information for accommodation and entertainment options away from the desktop.
Business Services will depend on the kind of specific service offered, but our group showed little variation from the average of 47%. This was somewhat surprising given the B2B nature assuming that research and information sourcing would be primarily done at a desktop. It is however, still a high mobile percentage.
Our Not for Profit group are predominately disability services, and again, to have one-third using a mobile phone is expected due to mobile devices being more accessible and easier to use for people with a disability. However a large proportion of people accessing not for profit websites are other agencies and service providers where the desktop is still a dominant tool.
Lastly, the Industrial & Manufacturing sector is the smallest percentage but still more than one in four. Another example of primarily B2B businesses accessing for value chain information, to potential alienate more than a quarter of your visitors by having a site that is not mobile friendly is not wise to say the least.
The questions we want to ask you as the business owner or representative are:
- How well does your site perform on a mobile phone or tablet?
- Is the percentage of total website visitors that your mobile sessions represent high enough for this to be a concern?
- Are you losing out because visitors are swiping back because they had to work too hard to find what they were looking for on your site?
We invite you to contact us if you are interested in having your site assessed and to start thinking about your mobile market. Also, if you would like more specific demographic or technological data for your business type, we have access to a variety of confidential data to be able to help.


